A numerical simulation was conducted to analyze the quenching and cooling process of low-carbon alloy steel pipes. The microstructures at three different positions within the forgings after quenching were predicted and subsequently validated through experimental testing. The results show good agreement between the predicted and experimentally observed microstructures. Granular bainite was identified at the 1/4 wall thickness from both the inner and outer surfaces, as well as at the center of the wall thickness. After tempering, slight variations in mechanical properties were observed among the three positions. The microstructures primarily consisted of ferrite and carbides, with some undecomposed martensite–austenite (M/A) islands remaining.
Low-carbon alloy steel for shipborne tubular forgings is typically subjected to a series of heat treatments after forging, including normalizing, quenching, and tempering. Due to the rapid cooling rate during quenching and the varying wall thickness, different regions within the forging experience different cooling rates. This results in variations in both microstructure and mechanical properties. Studying the performance of internal regions, such as the 1/4 wall thickness or the mid-wall section, using full-size forgings can lead to significant material waste. Therefore, it is essential to predict and verify the microstructural and property changes after quenching and tempering through a combined approach of numerical simulation and experimental validation.
Chen Chen et al. used finite element simulation software to model the oil cooling process at the 1/4 wall thickness position of a 5 MW wind turbine yaw bearing ring and validated their model through experimental testing. By comparing the microstructures and mechanical properties of three different materials—40CrMo steel, 40CrNiMo steel, and 40CrNiMoB steel—after simulated oil quenching and tempering, they identified the optimal material for manufacturing large bearing rings. Similarly, Weiping Pan, Dashan Sui, and others conducted numerical simulations and experimental studies on the heat treatment of 42CrMo+Ni shaft forgings and GS35CrMoV104V wheel castings, finding that the simulation results closely matched the experimental outcomes. In this study, numerical simulation and experimental analysis were conducted to investigate the quenching and cooling behavior of ship-grade tubular forgings. The aim was to elucidate the microstructural and property variations at different positions within the forgings after quenching and tempering, and to provide theoretical guidance for optimizing the heat treatment process of low-carbon alloy steel tubular forgings.
The three-dimensional geometry of the tubular forging is shown in Figure 1. The effective wall thickness during quenching is 370 mm, located at the lower flange. The actual heat treatment process applied to the forging is detailed in Table 1. A 3D model of the forging was created using Pro/E software and imported into Deform software to simulate the cooling behavior during quenching. Cooling curves were obtained at three specific positions: 1/4 of the wall thickness from the inner surface (P), the mid-wall thickness (Pz), and 1/4 of the wall thickness from the outer surface (Ps), as illustrated in Figure 1b. The simulation assumes the entire forging is quenched in water. The initial forging temperature is set at 880 °C, the water temperature at 20 °C, and the interfacial heat transfer coefficient during water cooling is specified as 5500 W/(m²·K). Cooling curves at the designated positions were obtained from the simulation.
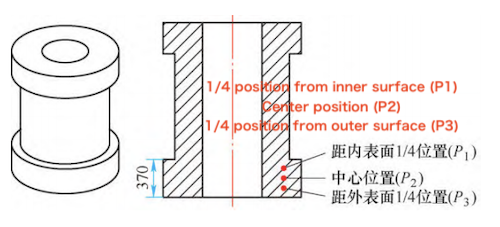
a) Three-dimensional structure of the forging b) Node selection positions
Figure 1 Three-dimensional structure of forgings and node selection position
Table 1 Heat Treatment System of Forgings
|
Heat Treatment |
Holding Temperature (°C) |
Holding Time (h) |
Cooling Method |
|
Normalizing |
880 |
7 |
Air cooling |
|
Quenching |
880 |
8 |
Water cooling |
|
Tempering |
650 |
10 |
Air cooling |
The test material was sourced from low-carbon alloy steel forging bars, with its chemical composition listed in Table 2. To construct the continuous cooling transformation (CCT) diagram and analyze phase transformation products at different cooling rates, thermal expansion tests were performed. The test samples measured Ø3 mm × 10 mm and were tested using a LINSEIS thermal expansion phase change instrument. The heat treatment test block measured 70 mm × 65 mm × 15 mm. First, the test block was normalized at 880 °C, held for 7 hours, and then air-cooled. For the simulated quenching heat treatment, the temperature-time profile obtained from the quenching simulation was programmed into an MR-20 simulated heat treatment furnace, which uses PID control for precise temperature regulation. During the simulated quenching process, the temperature was lowered following the predefined temperature-time curve. The simulated quenching was performed after heating the sample to 880 °C and holding it for 8 hours. Finally, the sample was tempered at 650 °C for 10 hours, followed by air cooling.
Table 2. Chemical composition of low-carbon alloy steel (mass fraction, %)
|
Element |
C |
Si |
Mn |
P |
S |
Ni |
Cr |
Mo |
V |
Cu |
|
Content |
0.20 |
0.27 |
0.51 |
0.008 |
0.005 |
2.67 |
1.05 |
0.23 |
0.05 |
0.02 |
Room temperature tensile specimens were standard 5 mm samples, tested using a Shimadzu AG-100kN tensile testing machine (Japan) in accordance with GB/T 228-2010, Metallic Materials—Tensile Testing at Room Temperature. Low-temperature (−20 °C) impact specimens, measuring 55 mm × 10 mm × 10 mm with a V-notch, were tested using an RKP450 pendulum impact testing machine in accordance with GB/T 229-2007, Metallic Materials—Charpy Pendulum Impact Test Method. For microstructure observation, specimens measuring 20 mm × 10 mm × 10 mm were prepared. A 4% nitric acid alcohol solution was used as the etchant, and the specimens were examined using an Olympus optical microscope.
Figure 2 shows the temperature curves at the inner surface, outer surface, and mid-wall thickness of the forging, as obtained from the quenching simulation. As shown in the figure, it takes approximately 30 minutes for all measured points to cool below 200 °C. During the water cooling process, heat transfers from the interior to the exterior of the forging. As the surface temperature decreases, the core continuously and uniformly conducts heat outward. Since point P—located at 1/4 of the wall thickness from the outer surface—is closer to the surface, it experiences a higher cooling rate compared to the center of the wall thickness. Once the temperature drops into the low range (below 300 °C), heat transfer between the water and the forging becomes less efficient. However, due to continued internal heat conduction from the core to the surface, the cooling rates at the three positions gradually converge.
By comparing the cooling curves with the continuous cooling transformation (CCT) diagram, the microstructures formed at different positions after cooling can be predicted, as shown in Figure 2b. According to the CCT diagram, a cooling rate above 5 °C/s produces a fully martensitic structure, while cooling rates below 5 °C/s result in a mixed bainite–martensite structure. As the cooling rate decreases further, the bainite transformation temperature rises, resulting in a higher proportion of bainite and a reduced martensite content. At a cooling rate of 1 °C/s, a fully bainitic structure is formed. By analyzing the cooling curves together with the CCT diagram, it is evident that all three monitored positions within the forging develop a fully bainitic microstructure after quenching.
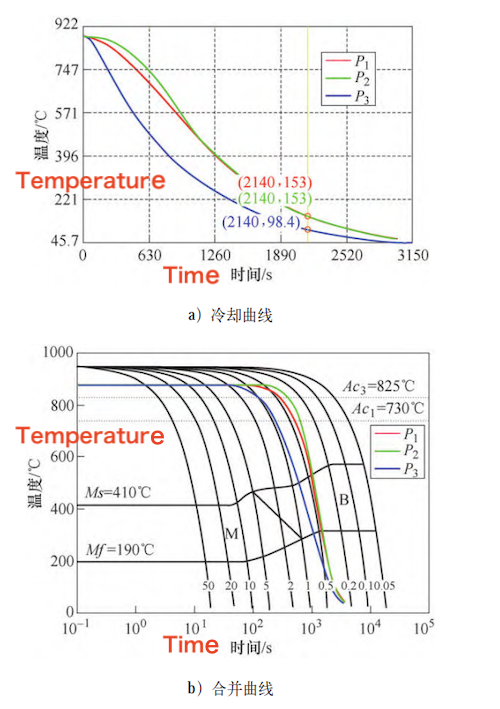
a) Cooling curve b) Merging curve
Figure 2 Cooling curves and corresponding CCT overlay
After simulated quenching heat treatment, the microstructures of the forging at three locations—1/4 wall thickness from the inner surface, 1/4 wall thickness from the outer surface, and the center of the wall thickness—are shown in Figure 3. As illustrated, the microstructures at all three positions consist of a ferrite matrix with M/A (martensite/austenite) islands, forming a granular bainite structure that generally aligns with the simulation results. During the bainitic transformation, ferrite precipitates from the supercooled austenite, while carbon diffuses uphill into the remaining austenite, enriching it. Upon further cooling, this carbon-rich region partially transforms into martensite, leading to the formation of M/A islands. Figure 3 reveals two distinct morphologies of M/A islands: one is blocky, appearing either as continuous distributions along grain boundaries (indicated by green arrows) or isolated within the ferrite matrix (yellow arrows); the other morphology consists of elongated, parallel features within the ferrite matrix (highlighted by the red dotted line). Across the different sampling locations, the morphology and distribution of M/A islands are similar, which can be attributed to the nearly uniform cooling rates during simulated quenching, as shown in the cooling curves in Figure 2b. This similarity in cooling rates results in comparable matrix structures and precipitate phase distributions within the microstructure.
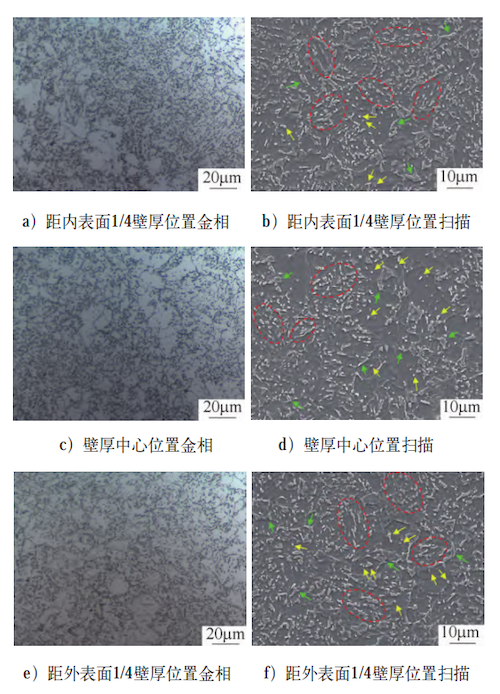
a) Metallograph at 1/4 wall thickness from the inner surface
b) Scan at 1/4 wall thickness from the inner surface
c) Metallograph at the center of the wall thickness
d) Scan at the center of the wall thickness
e) Metallograph at 1/4 wall thickness from the outer surface
f) Scan at 1/4 wall thickness from the outer surface
Figure 3 Microstructures of selected positions in the forging after quenching
After tempering, the microstructures of the forging at three locations—1/4 wall thickness from the inner surface, 1/4 wall thickness from the outer surface, and the center of the wall thickness—are shown in Figure 4. During tempering, the ferrite in the quenched structure undergoes recovery and transforms into polygonal ferrite. The original large M/A (martensite/austenite) islands decompose into a mixture of ferrite and carbide, known as carbide clusters (highlighted by the green dotted lines in Figure 4). Simultaneously, dispersed carbides precipitate within the ferrite matrix (indicated by green arrows).
However, undecomposed M/A islands can still be observed at all three locations (marked with yellow arrows in Figure 4). This is primarily because the isolated M/A islands in the original quenched structure contained relatively low carbon content. These islands, formed from primary carbon-rich austenite, tend to decompose more readily during tempering. In contrast, the strip-shaped, discontinuously distributed M/A islands originate mainly from secondary carbon-rich austenite, which has a higher carbon content and is more resistant to decomposition during tempering.
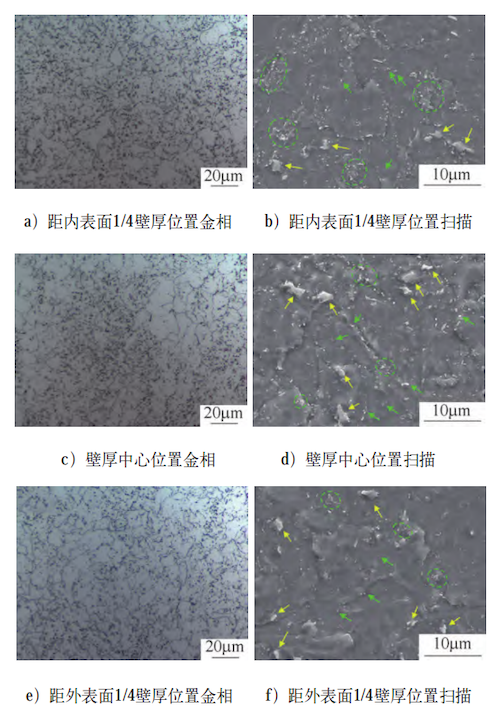
a) Metallograph (10 μm) at 1/4 wall thickness from the inner surface
b) SEM scan (20 μm) at 1/4 wall thickness from the inner surface
c) Metallograph (10 μm) at the center of the wall thickness
d) SEM scan (10 μm) at the center of the wall thickness
e) Metallograph (10 μm) at 1/4 wall thickness from the outer surface
f) SEM scan (10 μm) at 1/4 wall thickness from the outer surface
Figure 4 Microstructures at selected positions in the forging after tempering
As shown in Figure 4, after tempering, all three positions within the forging still contain partially undecomposed M/A (martensite/austenite) islands. The morphology and distribution of these islands can significantly affect the material’s mechanical properties. Large M/A islands can cause stress concentrations during fracture, and if the stress is not relieved promptly, cleavage cracks may initiate within these islands, adversely affecting the material’s toughness. In contrast, when M/A islands are small, they can serve as a strengthening phase, enhancing both strength and toughness. After tempering, alongside the dispersed fine carbides, some incompletely decomposed fine M/A islands remain in the matrix, helping to preserve desirable mechanical properties.
Figure 5 shows the tensile fracture morphology of the specimens after tempering. As illustrated, the fracture surfaces at all three positions exhibit dimples and tear ridges. The dimples are predominantly small and uniformly distributed, with fewer large and deep dimples observed. Dimples are also present along the tear edges, indicating that the material absorbed significant energy during fracture, which suggests improved tensile properties. The mechanical properties at different positions within the forging after tempering are summarized in Table 3. As shown, the variations in tensile strength, ductility, and low-temperature impact toughness among the selected positions are minimal, indicating a relatively uniform distribution of mechanical properties throughout the forging. The main reason for this uniformity is that the cooling rates at different positions during quenching were similar, resulting in comparable microstructures. Consequently, the size and distribution of carbides and M/A islands after tempering are also similar, leading to no significant variation in mechanical properties across the forging.
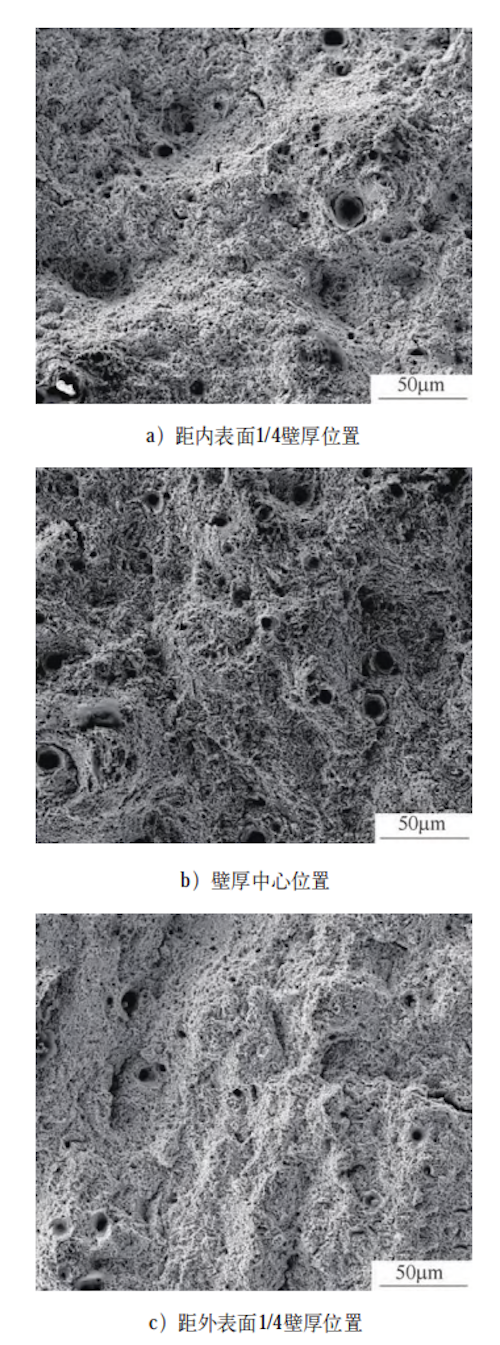
a) 50 μm from 1/4 wall thickness position near the inner surface
b) 50 μm from the center of the wall thickness
c) 1/4 wall thickness position near the outer surface
Figure 5 Fracture morphology of tensile specimens at different positions
Table 3. Mechanical properties of selected positions inside the forging
|
Positions |
Yield Strength ReL/ MPa |
Tensile Strength (Rm) / MPa |
Elongation (A / %) |
Section Shrinkage (Z / %) |
–20 °C Impact Absorption Energy (KV2 / J) |
|
1/4 wall thickness from inner surface |
660 |
776 |
23.0 |
76 |
224 |
|
Center of wall thickness |
646 |
769 |
23.0 |
77 |
227 |
|
1/4 wall thickness from outer surface |
660 |
779 |
22.5 |
76 |
213 |
- Numerical simulation results indicate that, after quenching, the microstructure at both the 1/4 wall thickness position and the center of the wall thickness consists entirely of bainite.
- Experimental validation confirms that the granular bainite observed at both the 1/4 wall thickness position and the center of the wall thickness closely matches the simulation results.
- After tempering, the microstructure at all three selected positions consists of ferrite and carbides, along with some undecomposed M/A islands. Since the quenched microstructures are essentially the same, the differences in the tempered structures are minimal, resulting in no significant variation in mechanical properties among the three positions.